


After reading our article What is OLAP? it's time to dig into some examples of usage of the OLAP Layer in some real-life OLAP Databases / Data stores to cement our understanding of the power of Online Analytical Cubes and their advantages.
Historically they have been intensively used in Business Intelligence contexts but can also be very useful in Embedded Analytics requiring complex Analytical Solutions.
We will approach this from 3 different angles
Queries
The queries are based on clearly defined Business Semantics defined inside the OLAP model through its Semantic Modelling Layer.
We will use for our examples the de-facto standard in the OLAP world called MDX. MDX is very similar - some might say way too similar - to SQL. Let's look directly at our first query from our very own Gentle Introduction to MDX.
SELECT
    ([Geography].[Geo].[Country].members) ON 0,
    ([Time].[Year].members ) ON 1
FROM
    [Sales]
What does this mean?
It means to retrieve from a cube named "Sales" all the measures (which is implicitly here the default measure "amount of licenses") and organizes on two axes called 0 and 1, first listing the Countries of a Hierarchy called Geography and the other the Years of a hierarchy called Time. These Hierarchies called Dimensions are what gives the Multidimensional aspect to an OLAP Cube.
We can also - like in SQL - reduce the space of the query with a WHERE clause indicating to only take a sub-cube.
SELECT
([Geography].[Geo].[Country].members) ON 0,
([Time].[Year].members ) ON 1
FROM
[Sales]
WHERE
    [Time].[Calendar].[Year].[2010]
For more examples, we refer you to the aforementioned gentle introduction to get deeper into the OLAP Concepts.
Like for SQL, query builder is a good tool to use to help build more complex queries.
Furthermore these query, like in the SQL world, are subject to Data Level Security constraints according to internal policies of the company using the system.
Naturally, inside the query, many different calculations and other functions can be used to enrich or transform the data. Operations on the dimensions like Crossjoin or UniqueName. Mathematical functions on the Members like AddN, Avg and Count and, in the case of MDX+ in icCube complex analytical expressions like MultiLinearRegression.
Dashboarding / Reporting
All Reporting and Dashboarding projects as well as Embedded Analytics ones - where the host system functionalities and the Reports and Dashboards with some associated actions are combined - are about selecting a slice of the data, performing calculations and aggregations on that data and slicing and dicing it in order to explore the root causes of the specific results that are seen. The
Advantages of OLAP are obvious when matching the typical journey through the data of any end user. For instance, a ledger in a bank is made of accounts but then it's quite natural to want to see them aggregated on business units, product lines, departments and many other dimensions. Then when looking at KPIs at that level, in order to understand how things build up, we need to drill back down into the account level.
Examples from our Live Demo environment
You can find general examples of Dashboards and Reports using the features of OLAP on our Live Demo Environment.
Dashboards

You can edit the Dashboard and see, for instance, how the second KPI box is built.
Here is the query:
WITH
MEMBER [Measures].[#Customers 2018] AS ([Time].[Time].[Year].[2018],[Measures].[#Customers] )
MEMBER [Measures].[#Customers 2019] AS ([Time].[Time].[Year].[2019],[Measures].[#Customers] )
MEMBER [Measures].[Hist] AS Vector( [Time].[Time].[Year].members, [Measures].[#Customers] )
SELECT
{[#Customers 2019], [#Customers 2018], [Measures].[Hist]} ON 0
FROM [Sales]
We select the the measure Customers from 2018 and 2018 as two new Members along with a monthly view about the same and the KPI card widget then uses those to display the values.
Pivot Tables

KPI Cards

External Tools
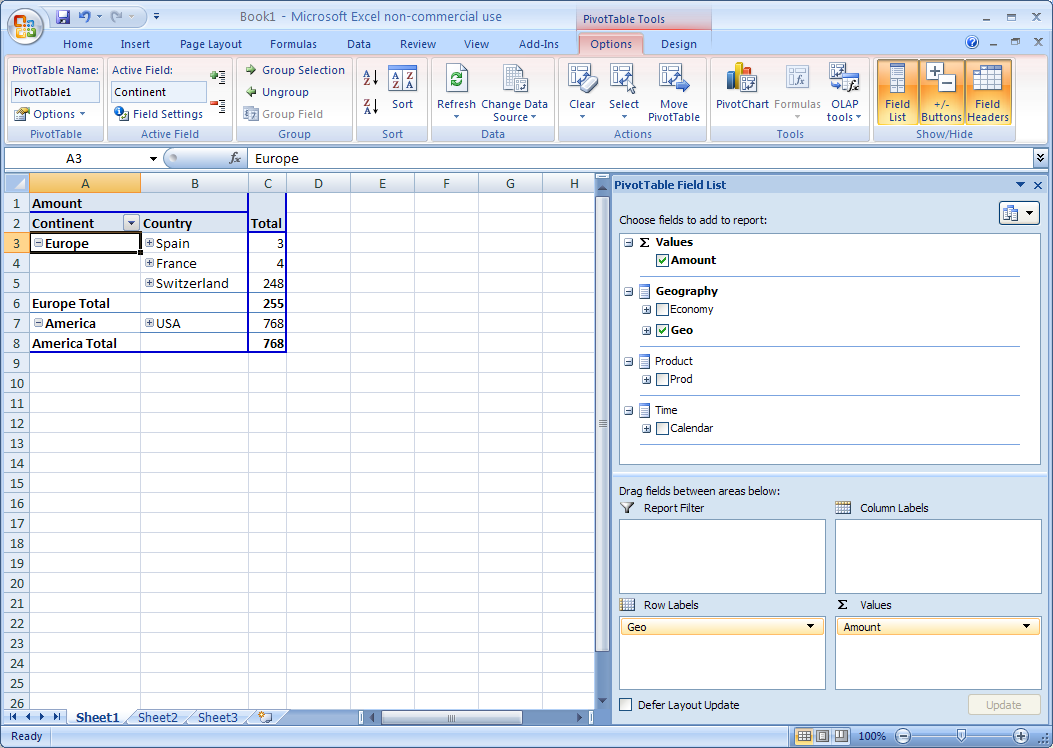
Excel
Excel integrates in their Pivot Table functionality, connection through XMLA to multidimensional / OLAP data sources.
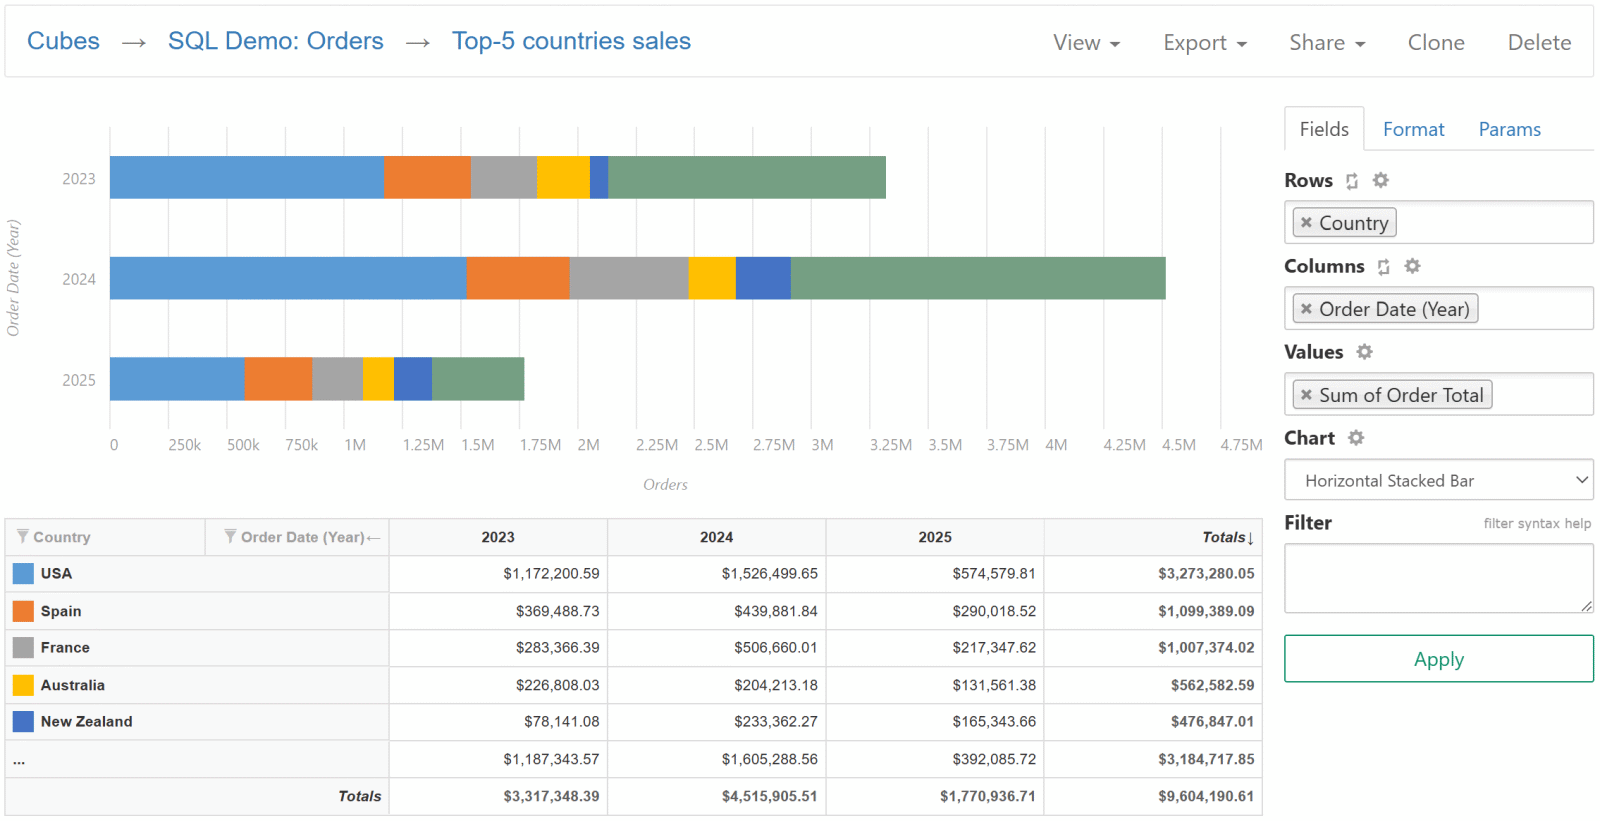
SeekTable
SeekTable is a self-service BI tool for ad-hoc data analytics, operational & embedded reporting with live tables & charts that supports various data sources including OLAP Databases / Data Sources supporting XMLA like icCube.
Real-Life Use-Cases / Solutions / Features
From our customer base, we can see various use cases of OLAP / Multidimensional principles. All are different but share the same need to rollup data on multiple hierarchies, slice and dice the data for specific KPIs and other reports and Dashboards and drill down onto lower level data to investigate issues and places of potential action.
A sample of icCube clients and their Use Cases
- Real Time Trading Analysis
- Project Management & Revenue Control
- Integration with In-House Software & Real Time Dashboards
- Human Resources Analytics for Eindhoven Airport
- Financial Markets Advanced Analytics
- Weather Forecast for Aircraft Routes
Conclusion
This is a very short introduction to the power of OLAP, we encourage you to stay stuned for further posts on the topic and more broadly about analytics and their integrations. For continuing your discovery journey, have a look at our Demo Environment.